Digital Interfaces Expose Core Probability Mechanics in European and American Roulette Wheels
Parker Schmid · Jun 27, 2026
Digital Interfaces Expose Core Probability Mechanics in European and American Roulette Wheels
European roulette wheels contain 37 pockets including a single zero while American versions feature 38 pockets with both a zero and double zero and mobile applications now display these structural differences through interactive probability calculators that update in real time based on wheel type selection. Observers note that such features allow users to examine exact odds for straight-up bets which stand at 1 in 37 for European wheels compared to 1 in 38 for American configurations.
Wheel Construction and Baseline Odds
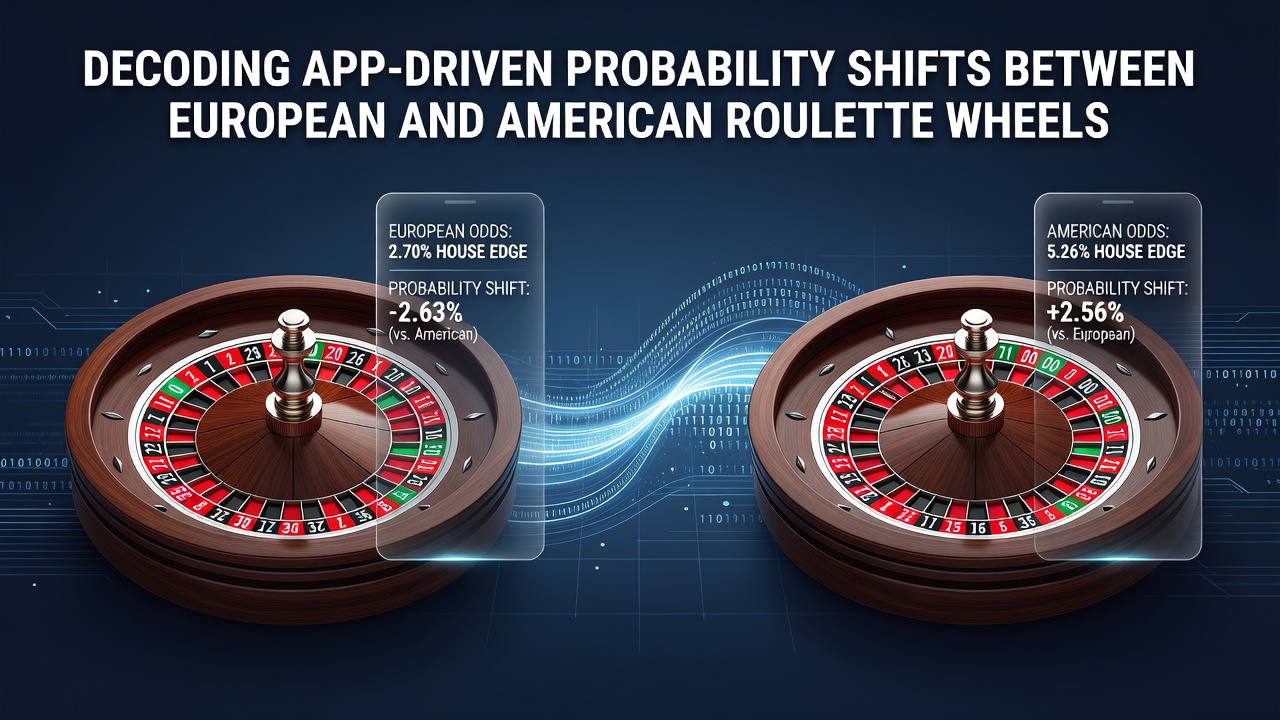
Researchers have documented how the extra pocket in American roulette alters payout ratios across all bet categories and apps integrate these calculations by pulling from certified random number generators that mirror physical wheel distributions according to standards set by bodies such as the Nevada Gaming Control Board. Data from independent testing labs shows European variants maintain a house edge of 2.70 percent on most wagers whereas American wheels reach 5.26 percent due to the additional zero and application interfaces often present side-by-side comparisons so players can review these variances without manual computation.
Studies from mathematics departments at institutions including the University of Sydney have modeled sequences of spins to confirm that the probability shift remains constant regardless of prior outcomes yet certain apps incorporate streak trackers that highlight patterns users might misinterpret as momentum changes. Those trackers draw from the same RNG protocols that govern live dealer streams and land-based machines alike.
App Features That Illustrate Probability Adjustments
Application developers embed simulation modes where users select either wheel variant and observe projected return percentages over thousands of spins and these tools rely on statistical models verified through audits by organizations like the Gaming Laboratories International. In June 2026 several platforms introduced updated modules that factor in regional regulatory requirements from Canadian provincial authorities which mandate clear disclosure of wheel specifications before each session begins.
What's interesting is how these digital environments connect bet selection directly to expected value displays so a player choosing a column bet sees the 2 to 1 payout alongside the adjusted probability of 12 in 37 for European wheels or 12 in 38 for American ones. Such integrations reduce reliance on external charts while maintaining accuracy across different device screen sizes.
Regulatory Context and Certification Processes
Industry reports from the European Gaming and Betting Association indicate that certified applications must undergo periodic RNG evaluations to ensure outcomes align with declared wheel probabilities and this process covers both European and American formats offered within the same interface. Analysts observe that cross-border operators adjust their probability engines based on jurisdiction which sometimes results in users switching between variants mid-session to compare outcomes under controlled conditions.
One case documented by independent reviewers involved an app update that added visual overlays showing zero pocket frequency during extended play sessions and these overlays helped clarify why American configurations produce slightly different long-term distributions compared to their European counterparts.

Simulation Data and User Interaction Patterns
Academic papers published through the Journal of Gambling Studies have analyzed aggregated anonymized data from multiple platforms and found that users frequently toggle between wheel types within a single session to explore how the double zero affects recovery sequences after losses. These patterns emerge because applications surface the information in digestible formats such as percentage breakdowns and expected value graphs rather than raw mathematical formulas.
Applications also connect to external data feeds from testing agencies in Australia where state regulators require transparent reporting of all game parameters including pocket counts and corresponding probabilities. This linkage ensures the displayed figures remain consistent with physical counterparts used in licensed venues worldwide.
Conclusion
Application-driven presentations of roulette probabilities continue to evolve through integration of certified data sources and region-specific compliance rules while the fundamental distinctions between European and American wheel structures remain fixed points of reference. Observers continue to track how these tools refine user understanding of odds without altering the underlying mechanics of either variant.